Predstavme si spoločne lead a obchodnú príležitosť ako súčasť widgetov a reportov.
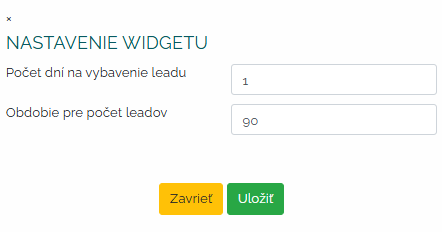
Vďaka nasledovnému widgetu budete mať prehľad o aktuálnom stave leadov v rámci firmy. Widget vám umožňuje sledovať celkový počet nových, otvorených alebo nevybavených leadov. S týmto novým widgetom budete mať vždy na dosah ruky všetky zásadné informácie, potrebné na efektívne riadenie vášho obchodu. Najskôr je potrebné tak ako pri ostatných widgetoch si aj tento nadstaviť. Stanovíme si počet dní na vybavenie leadu a obdobie v ktorom chceme aby sa nám spracoval údaj o počte leadov.
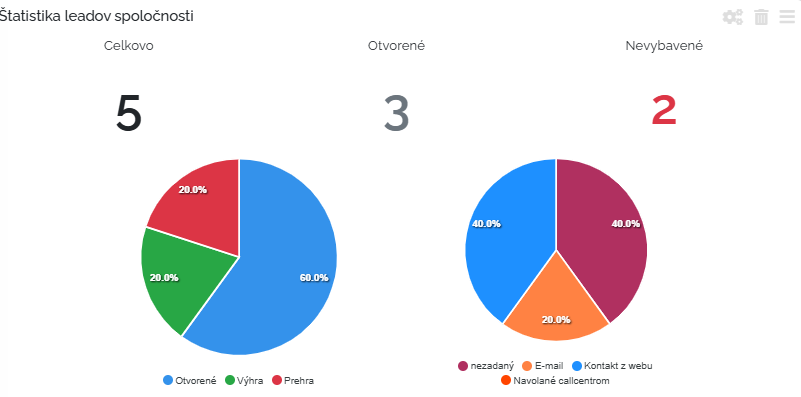
Následne sa nám vytvorí štatistika leadov spoločnosti. Nájdeme v nej ako vidíme sumárne čísla. Ale rovnako aj rozobrané jednotlivé leady podľa statusu: otvorené, výhra a prehra. A taktiež aj zdroj odkiaľ lead prichádza. Či už je to e-mail, internet alebo callcentrum, prípadne iný zdroj. Tento widget nám naozaj umožňuje mať celkový prehľad o leadoch.
Poďme sa ďalej pozrieť na reporty, ktoré sa viažu k leadom a obchodným príležitostiam.
Prvý report, ktorý si predstavíme je analýza obchodných príležitostí.
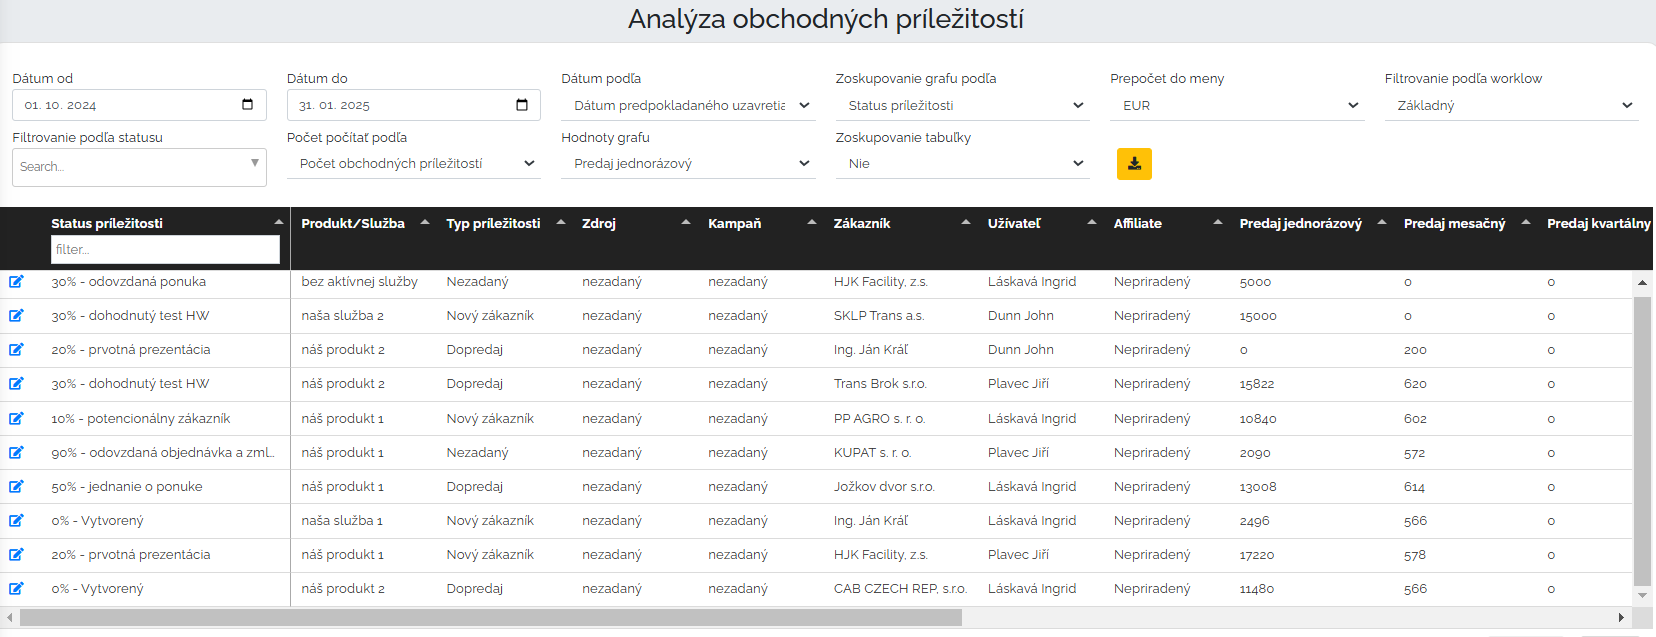
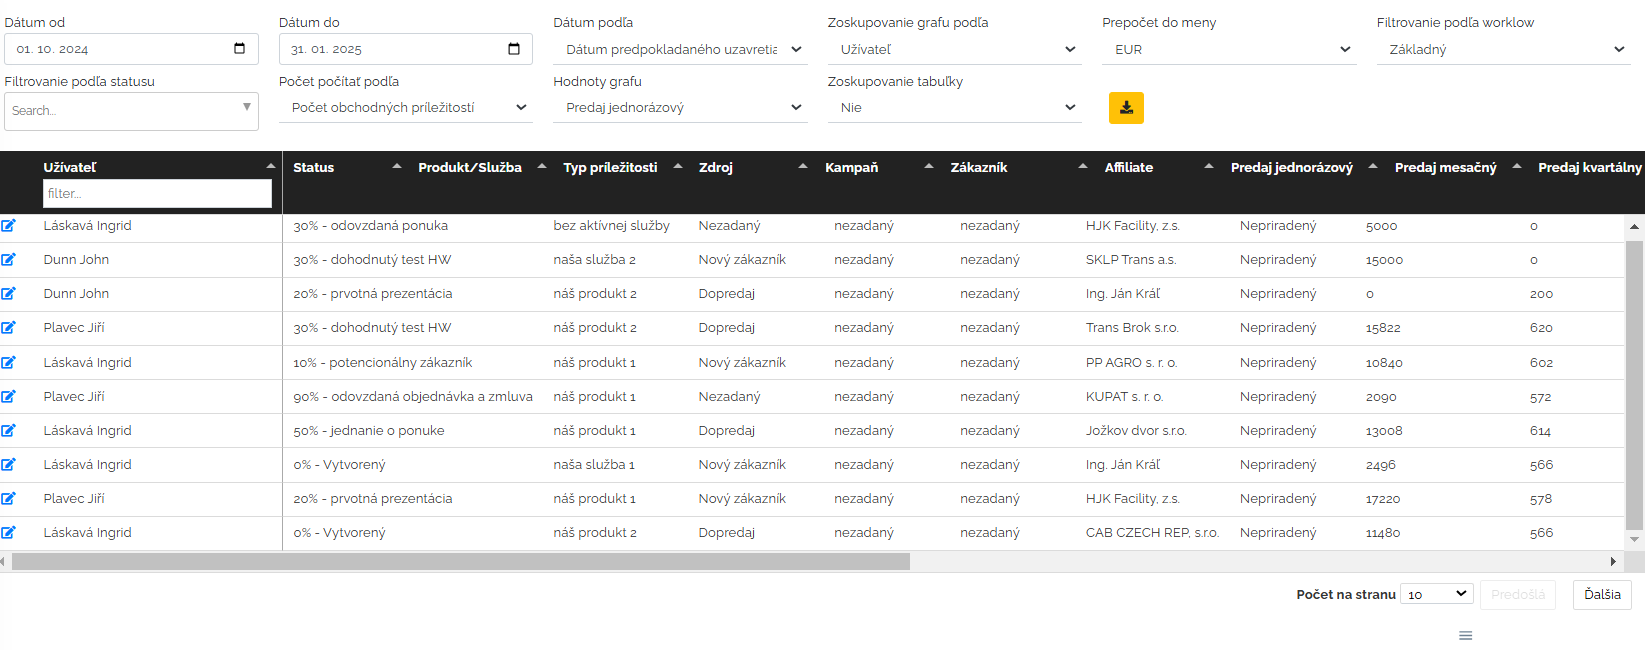
Obchodníci pri svojej práci samozrejme plnia v mangu rôzne obchodné príležitosti, s rôznymi dátami. Údajov je v sekcii obchodné príležitosti naozaj veľa a pokiaľ chceme tieto dáta analyzovať ďalej s nimi pracovať, tak na to nám práve slúži tento report. Pri tejto analýze prvým krokom je, že si musíme vyprofilovať, čo chceme analyzovať, aké dáta chceme vidieť. Stanovíme si dátumové rozhranie. Ďalej si zvolíme či chceme vidieť dáta podľa dátumu vytvorenia alebo uzatvorenia. Rovnako si stanovíme ako chceme aby sa nám graf zoskupil. Či podľa statusu alebo podľa užívateľa, kampane, zdroja, služby a pod. Stanovíme si aj menu, workflow. Ďalej aké hodnoty v zmysle predaja a zisku máme započítavať - či už predaj alebo zisk mesačný, polročný ... Po nadstavení parametrov máme report na svete.
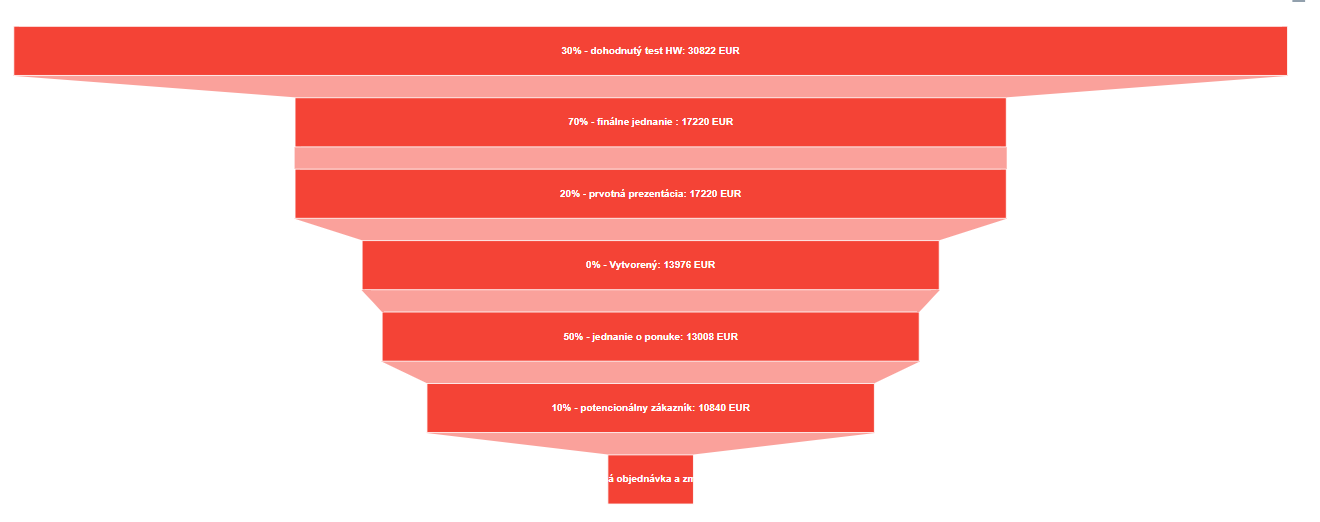
K tomuto konkrétnemu príkladu nám mango vytvorí tzv. stĺpcový graf. Tieto grafy si viem samozrejme tiež stiahnuť do počítača ako obrázok.
Poďme si teraz spolu predstaviť druhý report a to je analýza úspešnosti obchodných príležitostí.
V prvom reporte sme podrobili obchodné príležitosti analýze podľa statusu a užívateľov. V tomto druhom type analýzy sa pozrieme na ako, ako úspešné sú naše obchodné príležitosti. Rovnako si v úvode nadstavím parametre analýzy. Dátumový rozsah a dátum podľa akej udalosti, ďalej zoskupovanie grafu podľa rôznych kritérii ako užívateľ, produkt/služba a pod. Ďalej si môžeme zadefinovať aj workflow a či chceme tabuľku zoskupovať. Pozrime sa na príklad. Stanovili sme si časový úsek, podľa dátumu vytvorenia. Zoskupiť graf podľa užívateľa a vymedzili sme základný workflow.
Aj v tomto prípade platia rovnaké funkcie tabuľky ako na príkladoch vyššie. Grafické zobrazenie tohto príkladu by bolo nasledovné.
Vieme si v prehľadom grafickom zobrazení pozrieť, koľko obchodných príležitostí nám u ktorých užívateľov za vymedzené časové obdobie skončilo výhrou a koľko prehrou. V základe analýzy si viem filtrovať rôzne parametre, ktoré potrebujem aby sa mi premietli do tabuľkového zobrazenia a do grafu. Je len na manažérovi podľa čoho si praje analýzu zostaviť.
