Let's take a look together at how a manager can very easily create an image of his team's work.
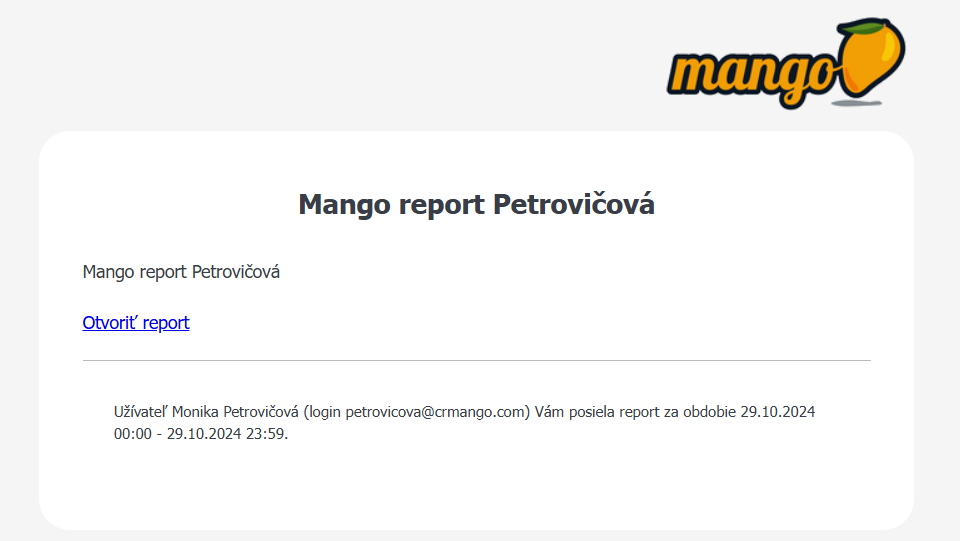
The manager usually does not have a part due to his workload dig in detail among hundreds of information in the system. He needs to get clear accurate, clear indicators about what his team was doing, what he was doing. Mango he knows how to provide this overview very skillfully. The trader simply fills during the day activities and at the end of the working day he sends a report to his superior, to whom an e-mail will simply arrive, through which you know view merchant report in clear timeline.
Just click and enter the password to open the reports and report in a beautiful clear timeline with graphic display individual activities is in the world. No laborious searching information. Fast, clear and simple. Let's take a look at it. First of all will show you a panel with the options of what activities you want to display in the report. It's on you whether you want to see all of them or you say to yourself that I only want to see the merchant's meetings and information about them. At the same time, you will also see a graphic timeline with activities of the merchant.
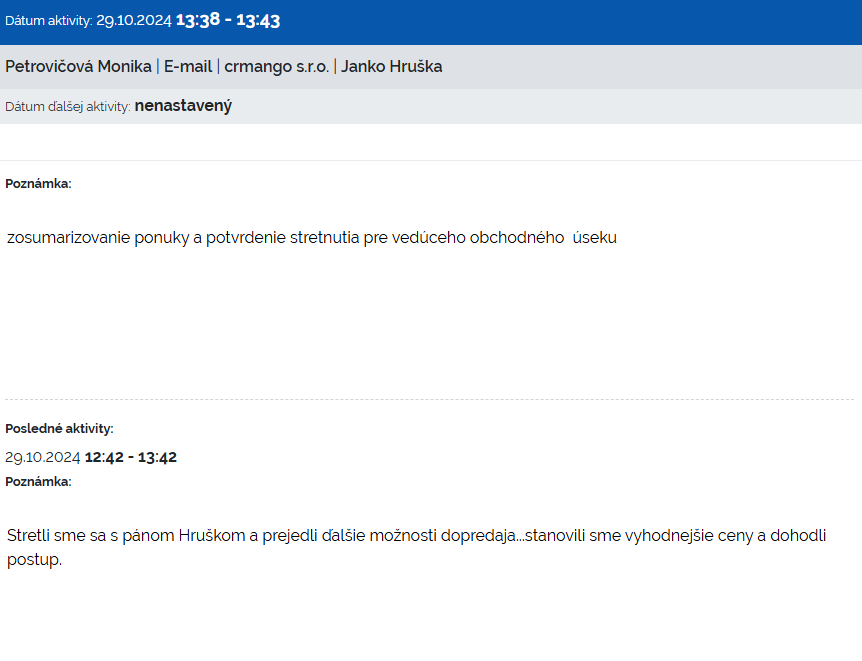
And then we get to clear timeline individual activities. For each activity, you can also view history the last ones three records.
This is what it looks like when you are a manager through blue + activity unpacks to see a history of recent entries.
All types of basic activities can be found in the report we can also report in them own activities. What are their own activities?


