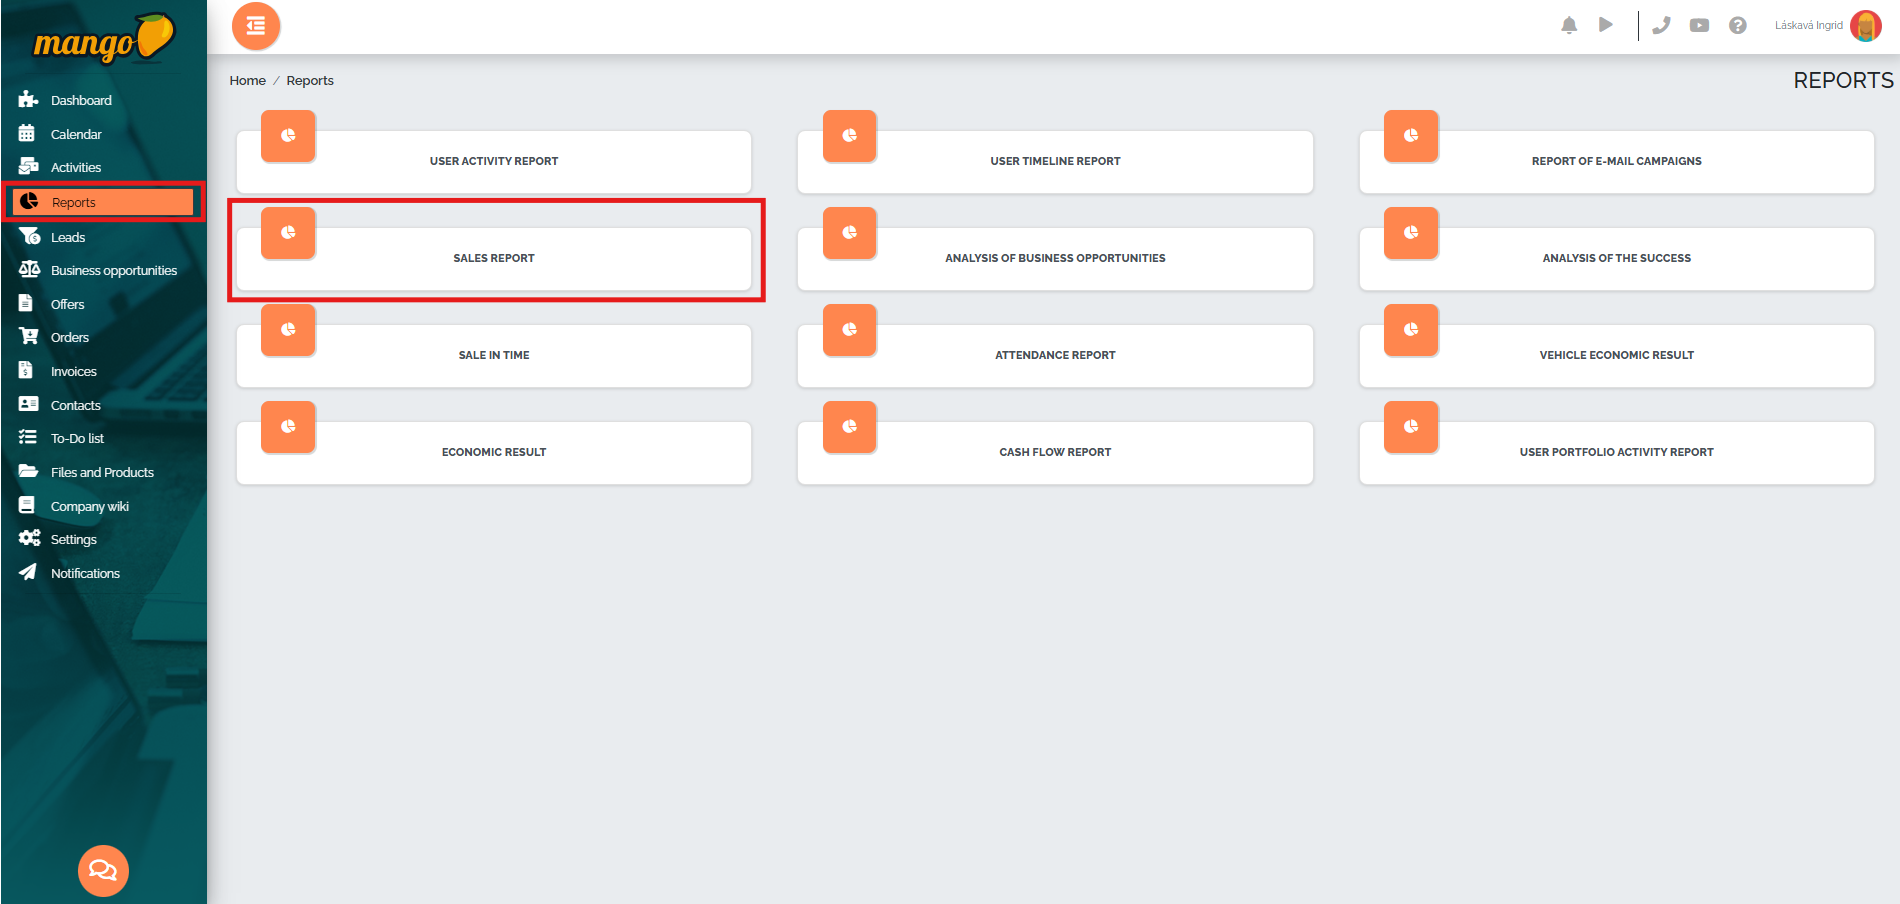
The sales report can be found in the Reports section:
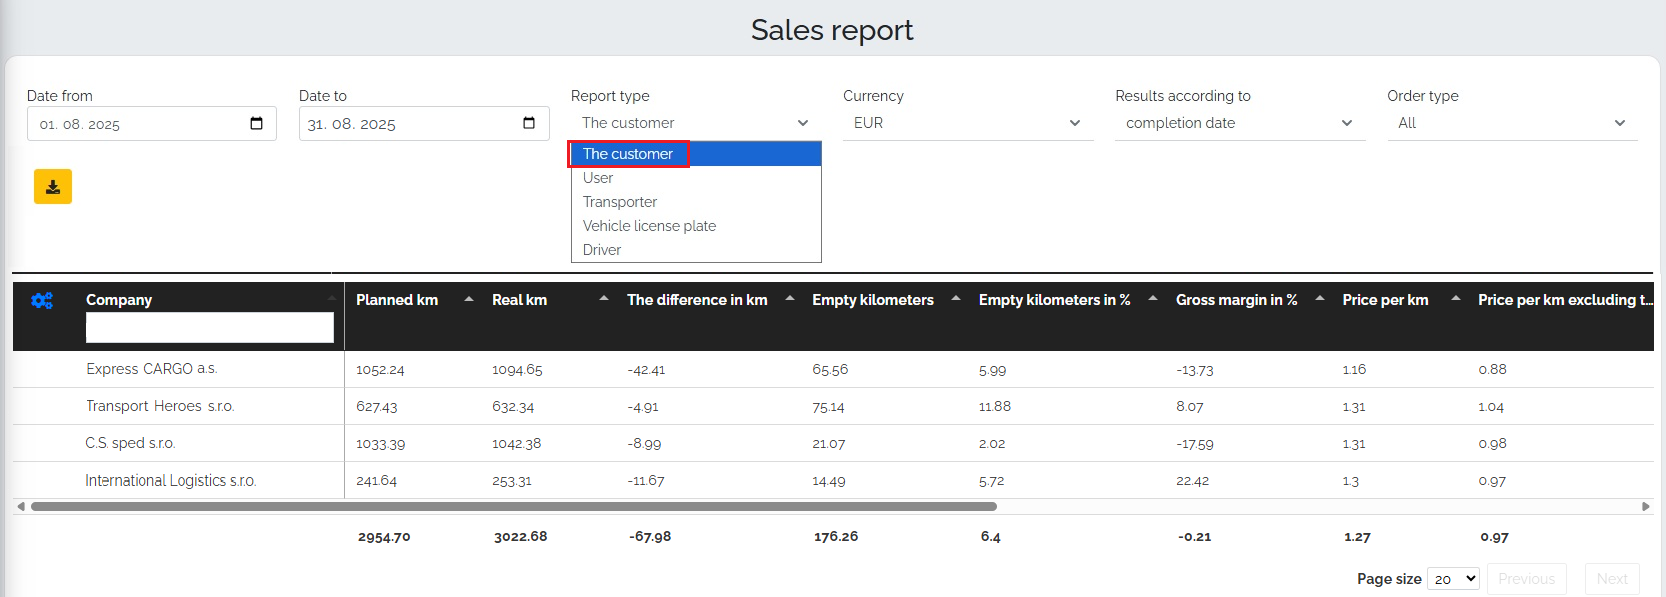
In the report header, we can set individual filters - such as the time period for which we want to create a report, the type of report (Customer, User, Carrier, Vehicle License Plate, Driver), menu, and sorting results by order status: completed, accepted, in progress, ready to complete, and order type: all, own, forwarding. Individual columns and options are also displayed according to our focus - whether we are a trading company or a transport/forwarding company.
For transport/freight forwarding companies, the report may look like this:
Below is an explanation of each column and the calculations of the values in this report:
- Planned km - sum of all planned km
- Real km - sum of all real km driven
- Km difference - difference between planned and actual km
Empty km - the sum of all km from the vehicles starting point to the first loading
Empty km in % - percentage of empty km vs. planned km
Total time - this column is informative if we select the Vehicle license plate option in the Report type field - it shows the total number of days the vehicle was in operation for the selected period
Time used - this column has a telling value if we select the Vehicle license plate option in the Report type field - it shows the total number of days during which the vehicle was in operation from the moment of loading to unloading for the selected period
Estimated time - a value that is calculated based on the Traffic module settings in the Settings section -> Advanced settings-> Traffic module -> Manage module
Difference - represents a value equal to the difference between the used time and the expected time.
First stop - represents the first date the vehicle arrived for the first loading
Last stop - represents the date the vehicle made its last unloading
Usage in % - percentage of used vs. total time - i.e. how many percent of the given period the vehicle was used
Gross margin - percentage expression of the ratio of profit from orders to total sales
Carrier price - this column expresses the sum of the carrier price for forwarding orders, i.e. how much we paid the carrier for transportation
Price per km - this is a value that is calculated as a one-time sale divided by planned km. If actual kilometers are listed for vehicles, we will use the actual kilometers value.
Price per km without toll - this value expresses the difference between one-time sales and toll costs divided by planned km. If real kilometers are indicated for vehicles, we will use the value real kilometers
Vehicle costs - represents the sum of all costs listed on the map - Driver costs - represents the sum of all costs listed on the map
- Toll costs - represents the sum of all costs listed on the map
- Fuel costs - represents the sum of all costs listed on the map
One-time sale - sum of sales price from orders
One-time profit - sum of profit from orders
Adjusted profit - calculates profit based on the number of days in the month for calculating fixed costs, which we have set in the Transport module in the Settings section -> Advanced settings-> Transport module -> Manage module.
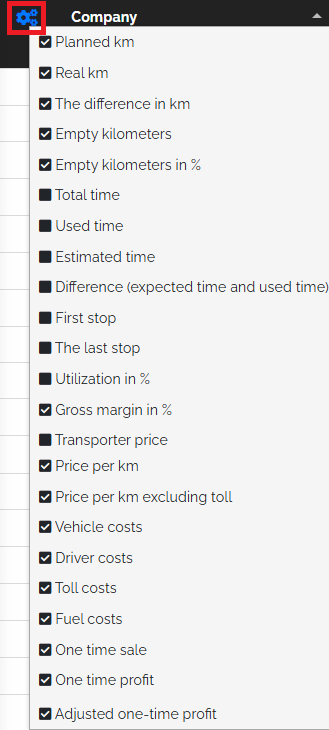
Using the blue settings button, you can view all available column types. However, for each report type, the system automatically pre-define the columns that are most relevant for the given report. If necessary, you can add or remove individual columns by clicking the blue settings button:
This report also includes a graphical representation of this table:

The report provides a quick and clear view of the companys operations - showing vehicle utilization and utilization, costs and opportunities for more efficient fleet use. It also reveals vehicles that are overloaded and allows you to assess whether the pricing policy is set correctly and the transport is profitable considering the costs of vehicles and drivers.
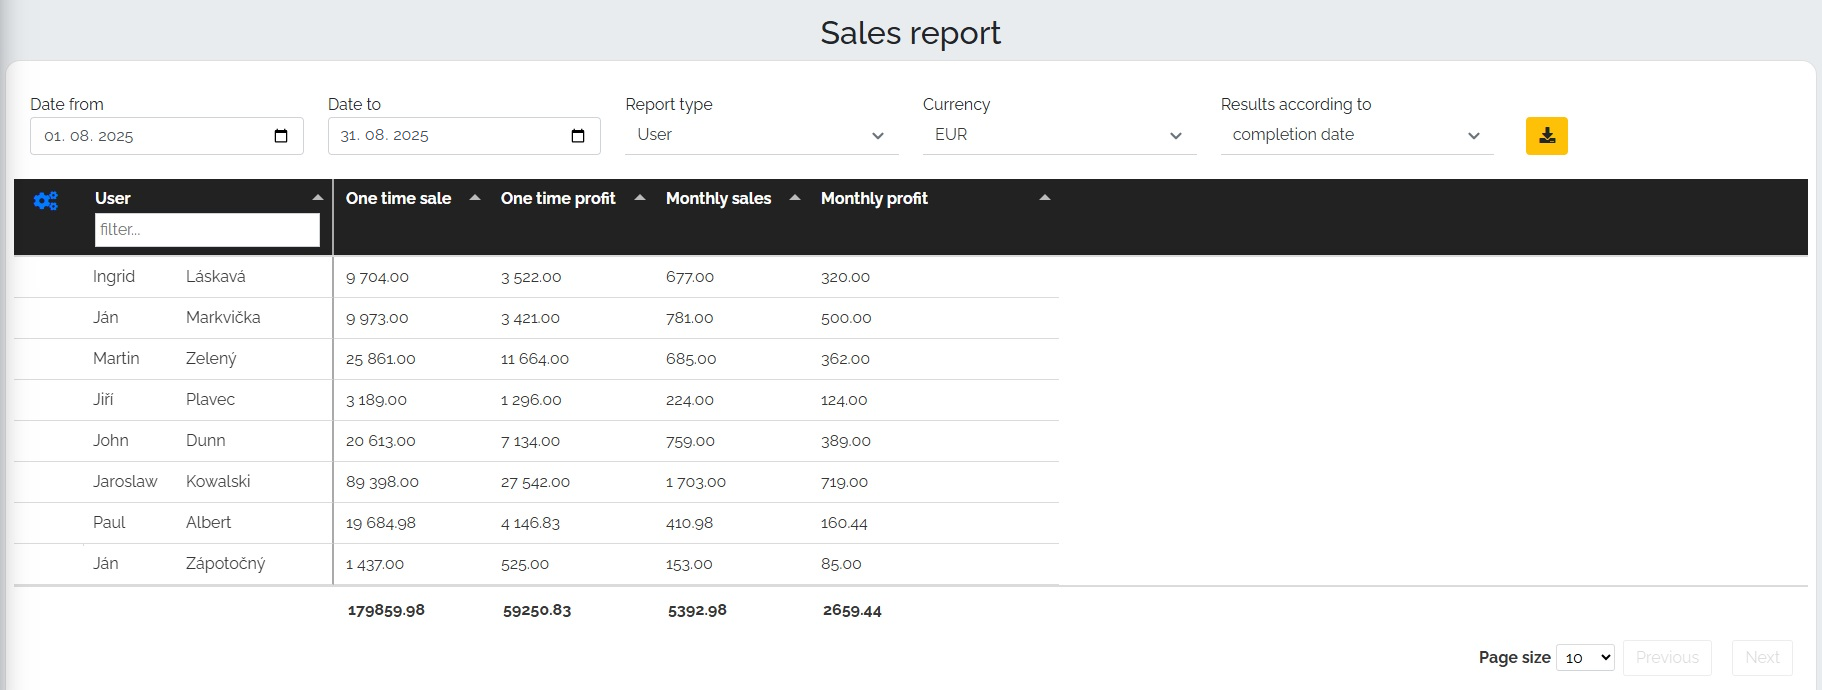
In the Mango store, we can find the following filters in the report header: time period for which we want to create a report, report type (Customer, User), menu, and sorting results by order type (completed, accepted, fulfillment date, ready for completion):
The report itself offers 4 columns and calculations of the values in this report:
- One-time sale - sum of sales price from orders
- One-time profit - sum of profit from orders
- Monthly sales - sum of monthly sales
- Monthly profit - sum of monthly profits.
Just below this report we find a graphical representation of this table:
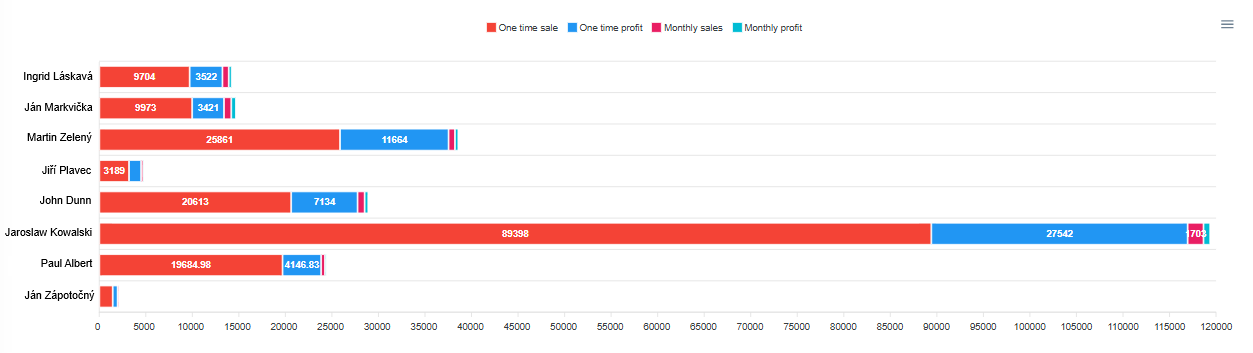
Such a report allows you to analyze profitability , compare the performance of the entire sales team or individuals , and gain insight into whether the pricing policy is set correctly.